Step back from the individual names and a clean structure appears. The producers in this sector are all doing one of four things, and the whole industry is migrating in one direction along the grade ladder. This final section ties the science, the numbers and the companies into a single mental model.
| Company | Started from | Core strength | Moving toward | FY26 outcome |
|---|---|---|---|---|
| Accent Microcell | MCC particle manufacture | Debt-free, export-led, capacity-constrained | Derivatives: CCS, SSG, CMC | Revenue +31%, PAT Rs 43.9 cr |
| Sigachi Industries | MCC scale leadership | Largest Indian capacity, export franchise | APIs, services, allied trades | Revenue –2%, net loss |
| Chemfield (Oji) | MCC, nitrosamine-free positioning | Now owned upstream by a pulp major | Integrated "tree to tablet" supply | Unlisted |
| JRS, Asahi Kasei, IFF | Formulation science | Co-processed and branded grades | Continuous-manufacturing systems | Divisions of larger groups |
| Ankit Pulps and the tail | Cellulose powder | Cost and local proximity | Mostly staying put | Unlisted; squeezed |
Table 10.1 — Four strategies. Note that only one of them — climbing within cellulosics toward derivatives and engineered systems — extends an existing moat. Backward integration secures input; diversification buys unrelated revenue; standing still invites the documentation tailwind to work against you.
1 · Two problems. A tablet must survive being made (mechanical, visible, forgiving) and must release its dose for years (chemical and kinetic, hidden, unforgiving). Everything follows from this.
2 · The particle is the moat, not the molecule. The chemistry is seventy years old and unpatented. What is scarce is reproducing a particle-size distribution batch after batch and proving it — which is why capability tracks operating decades, not capital.
3 · Barriers are built from the customer's switching cost. Three to five years to qualify a new source into an approved product. No patent involved. Reliability is the product — and an interruption hands your moat to your replacement.
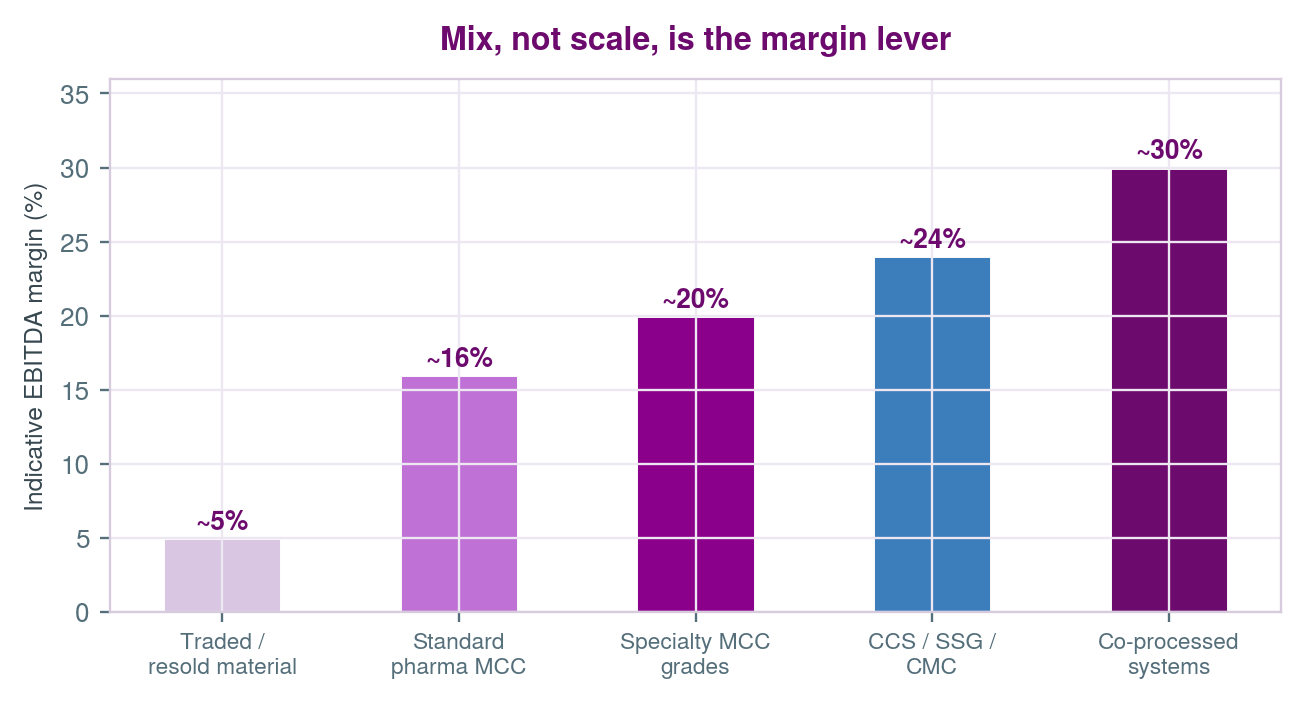
4 · Margin comes from grade mix, not scale. Tonnage buys pulp discounts; grade mix buys realisation. Diversifying out of the niche dilutes the only advantage you have.
5 · The demand shift is one-way. Every plant built without a granulator permanently upgrades the excipient specification it will buy. That mix shift, not market growth, is the real driver.
| The bull case | The bear case |
|---|---|
| Five concurrent demand cycles, two of which raise realisation rather than volume; a documentation tailwind that transfers share to DMF-holding producers without requiring market growth; genuine China-plus-one qualification activity favouring Indian suppliers; capacity expansions at both listed producers arriving into that demand; high switching costs protecting installed revenue; and debt-free balance sheets funding the step-up without dilution or leverage. | Roughly 26,000 MTPA of new Indian capacity landing in the same window in a market growing at 6–7%, with both producers betting identically; execution slippage already visible in the delayed Unit-III; pulp price and currency pass-through risk with limited hedging; customer concentration in the mid-40s percent of revenue at the top ten; the demonstrated fragility of a single-site manufacturing base; and valuations on the listed names that already discount successful execution. |
The honest synthesis: this is a good industry with a narrow moat and a wide execution requirement. The moat is real — qualification cycles genuinely protect incumbents, and the documentation tailwind genuinely compounds. But the moat protects existing revenue far better than it protects new revenue, and both Indian producers have just committed capital to roughly doubling output that must be sold into relationships they have not yet won.
The part of the bear case that most durably survives scrutiny is therefore not "demand is exhausted" — it plainly is not. It is that two capacity expansions are racing into the same window, and the premium grades that would justify them take years to qualify. That is an execution-and-mix risk, not a demand risk, and it is the thing to monitor quarter by quarter: the ratio of manufactured to traded volume, the share of derivatives in revenue, and realisation per tonne. A reader who has internalised the two-problem science, the switching-cost moat and the mix-over-scale margin lesson now holds the same core mental model a sector specialist carries.
1 · Realisation per tonne — the cleanest single measure of whether grade mix is actually improving.
2 · Manufactured versus traded volume share — falling traded share should mechanically lift margin.
3 · Commissioning progress at the new units, and the first revenue from derivative products.
4 · Customer concentration and export share — the first tells you fragility, the second tells you whether the qualification work is landing in regulated markets.