Three demand and revenue pools deserve separate treatment because they are systematically undercounted by headline market figures — and all three push the industry toward the premium end of the ladder.
A characteristic of this sector that market studies never capture is that producers routinely trade material alongside what they manufacture: buying third-party powder, qualifying it, repackaging it under their own quality system, and selling it into their own customer relationships. Accent Microcell, for example, reported total sales volume of roughly 15,000 metric tonnes in FY26 against installed capacity of about 9,200 MTPA — approximately 70% manufactured and 30% traded.
This is not a criticism; it is a rational response to being capacity-constrained in a market where losing a qualified customer is expensive. But it matters analytically for two reasons. It inflates revenue relative to manufacturing capability, and it dilutes margin, because traded material earns a distribution spread rather than a conversion margin. A company whose traded share is falling as new capacity commissions will show margin expansion that has nothing to do with pricing.
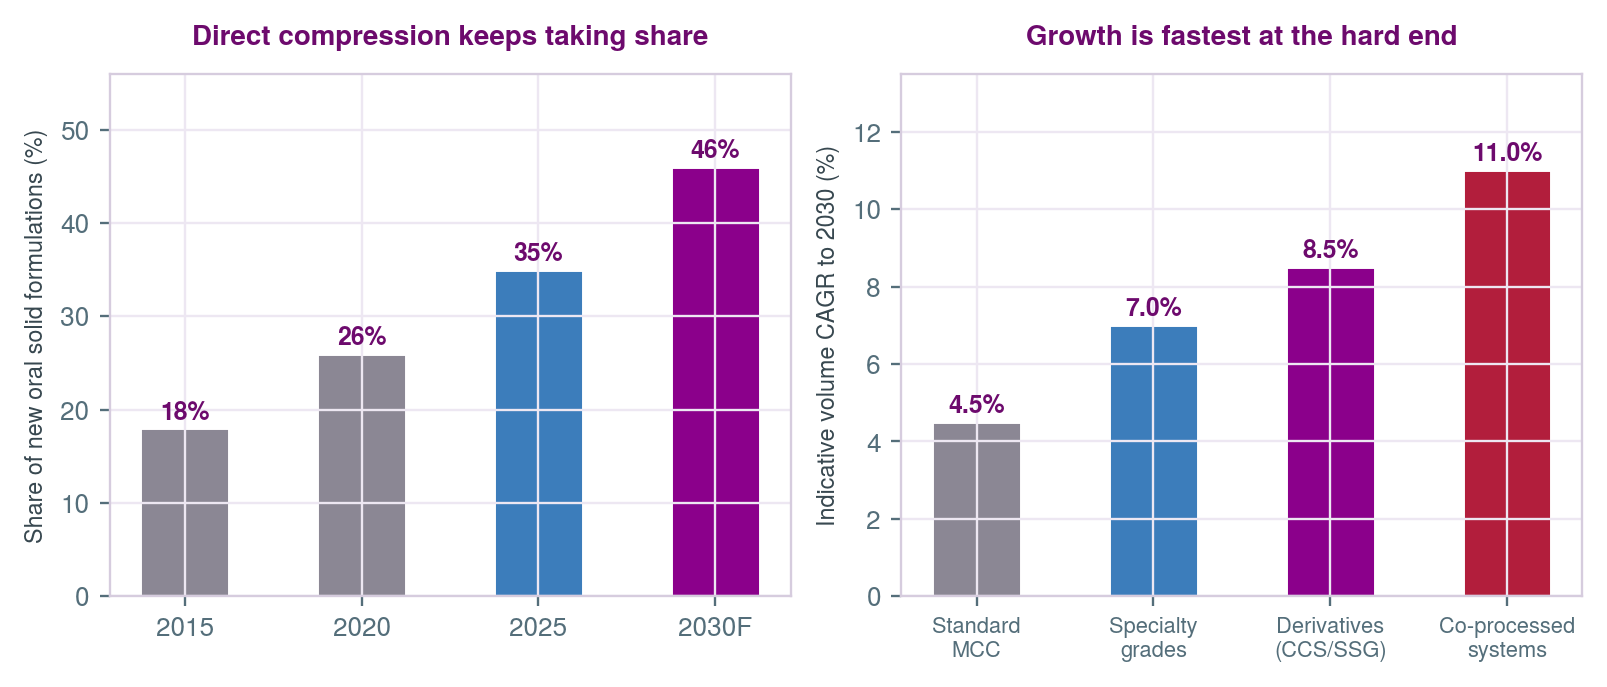
The second uncounted pool is the migration of value into engineered systems. Market studies size "microcrystalline cellulose" as a material; they do not capture the fact that an increasing share of MCC is sold inside a co-processed system at a materially higher realisation. Recent product launches aimed explicitly at continuous direct compression are the visible edge of this.
What makes it a rising tailwind is that it is driven by the very forces that constrain conventional demand: regulators pushing continuous manufacturing, formulators avoiding water and heat, and plants being designed for fewer unit operations. The headwind on the old process is the mechanism generating this tailwind.
The third pool is food, nutraceutical, bakery, dairy and cosmetic demand. Physically this is often the same material from the same line. Commercially it is a different business: lower specification, lower price, far shorter sales cycle, and almost no switching cost. Its virtue is that it is large, growing with clean-label formulation trends, and uncorrelated with pharmaceutical destocking cycles — so it keeps a plant loaded.
Its vice is that it is competitive on price and offers no protection. A producer whose mix drifts toward food and nutraceutical volume is buying revenue stability at the cost of margin and defensibility. Reading a company's disclosed application mix is therefore one of the more revealing things you can do with its annual report.
| Pharmaceutical channel | Food / nutraceutical channel | |
|---|---|---|
| Documentation | Monograph, DMF, audit, change control | Food safety certification; far lighter |
| Qualification time | Years | Weeks |
| Switching cost for the buyer | Very high — a regulatory variation | Near zero — a purchase order |
| Price behaviour | Sticky; renegotiated slowly | Tracks pulp and competitive tender |
| Role in the business | The margin and the moat | The ballast and the utilisation |
Table 8.1 — The same product sold two ways. The physical good is close to identical; the commercial characteristics are opposite. This is the closest analogue in this industry to the distinction between a contracted and a spot business — and it is why application mix, not tonnage, is the number to watch.
Figure 8.2 — The value chain and where the margin sits. Only one box in this chain converts a commodity into a specification — and correspondingly the only one carrying a regulatory liability for it. Accent and Sigachi sit in box two; Oji's purchase of Chemfield was box one buying box two.
Backward integration into pulp does not move a producer up the ladder — it moves them down it, toward commodity economics, in exchange for input security. Forward integration into co-processed systems and derivatives moves them up. When Oji Holdings, a Japanese pulp group, acquired a stake in an Indian MCC producer in March 2025 and described the logic as a "tree to tablet" chain, that was the pulp business buying its way up into specification — the same move, viewed from the other end of the chain.