Having covered the science, we now turn to the numbers — the market size, its shape, and the concurrent demand cycles that make this a structurally growing rather than cyclical business. It is also, as we will see, a market whose published size should be treated with real caution.
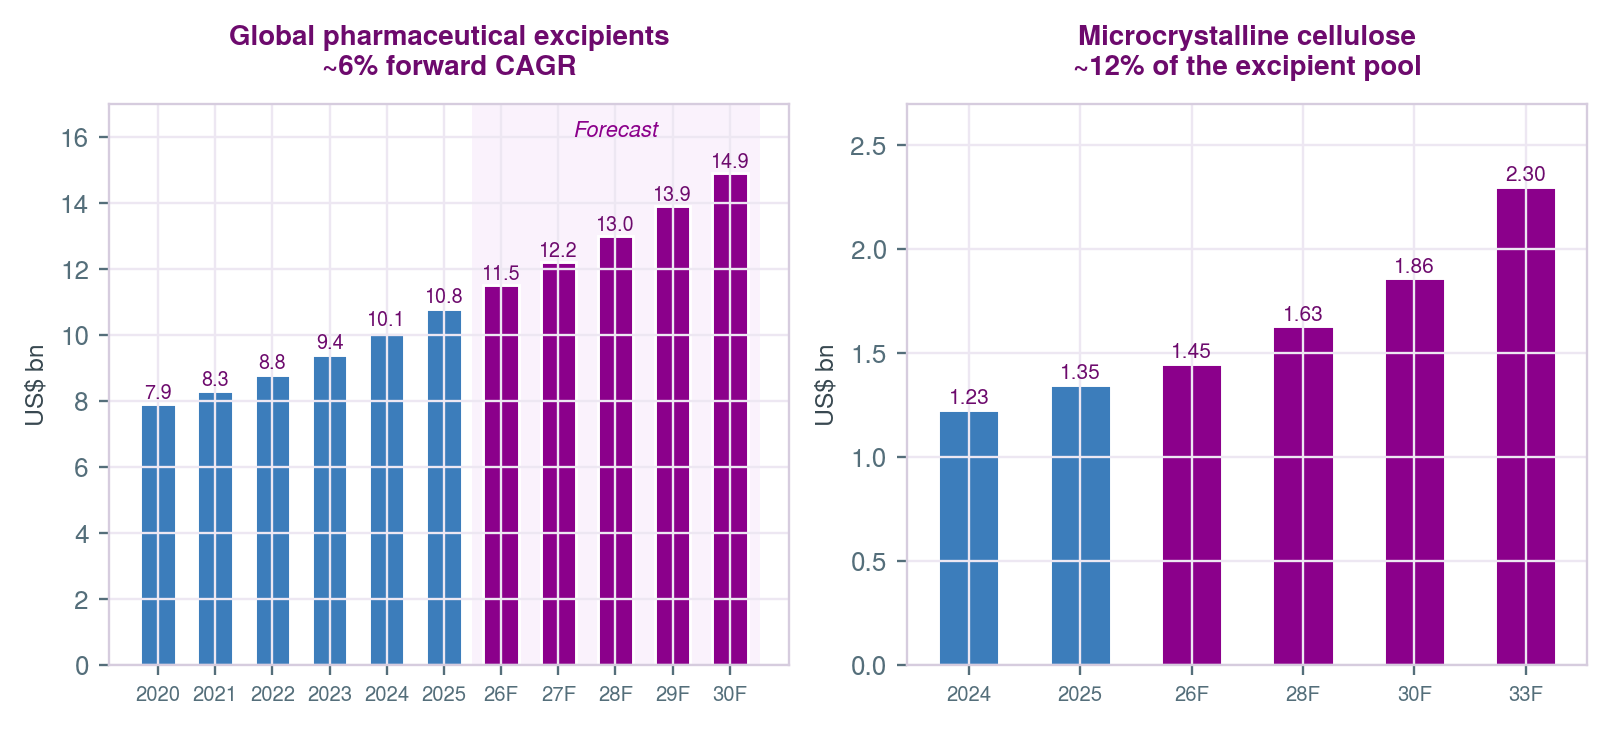
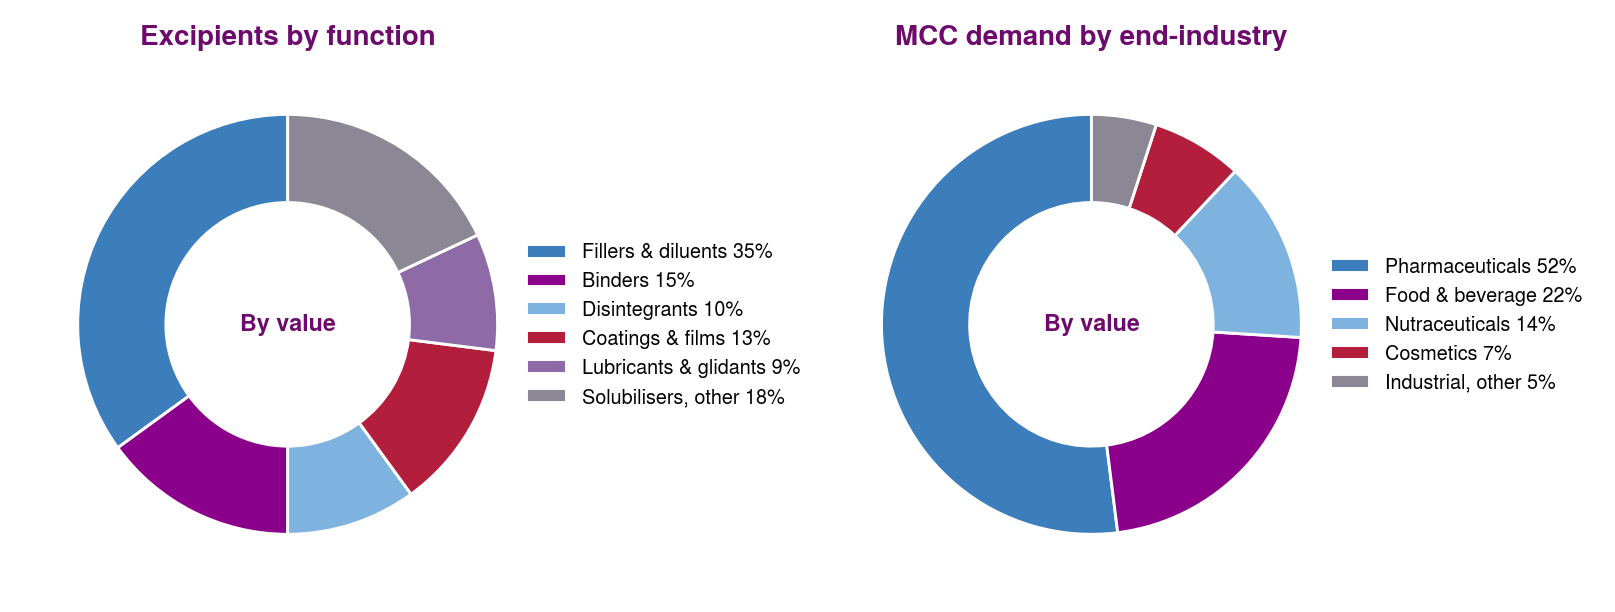
The global pharmaceutical excipients market is generally put at roughly US$10–11 billion in 2025, growing at a mid-single-digit rate toward US$15 billion by 2030. Microcrystalline cellulose is around US$1.3–1.5 billion of that, growing slightly faster at 6–7%, of which pharmaceutical applications are roughly half and food, nutraceutical and cosmetic uses make up the balance. Asia-Pacific is the fastest-growing region and India the fastest-growing country within it.
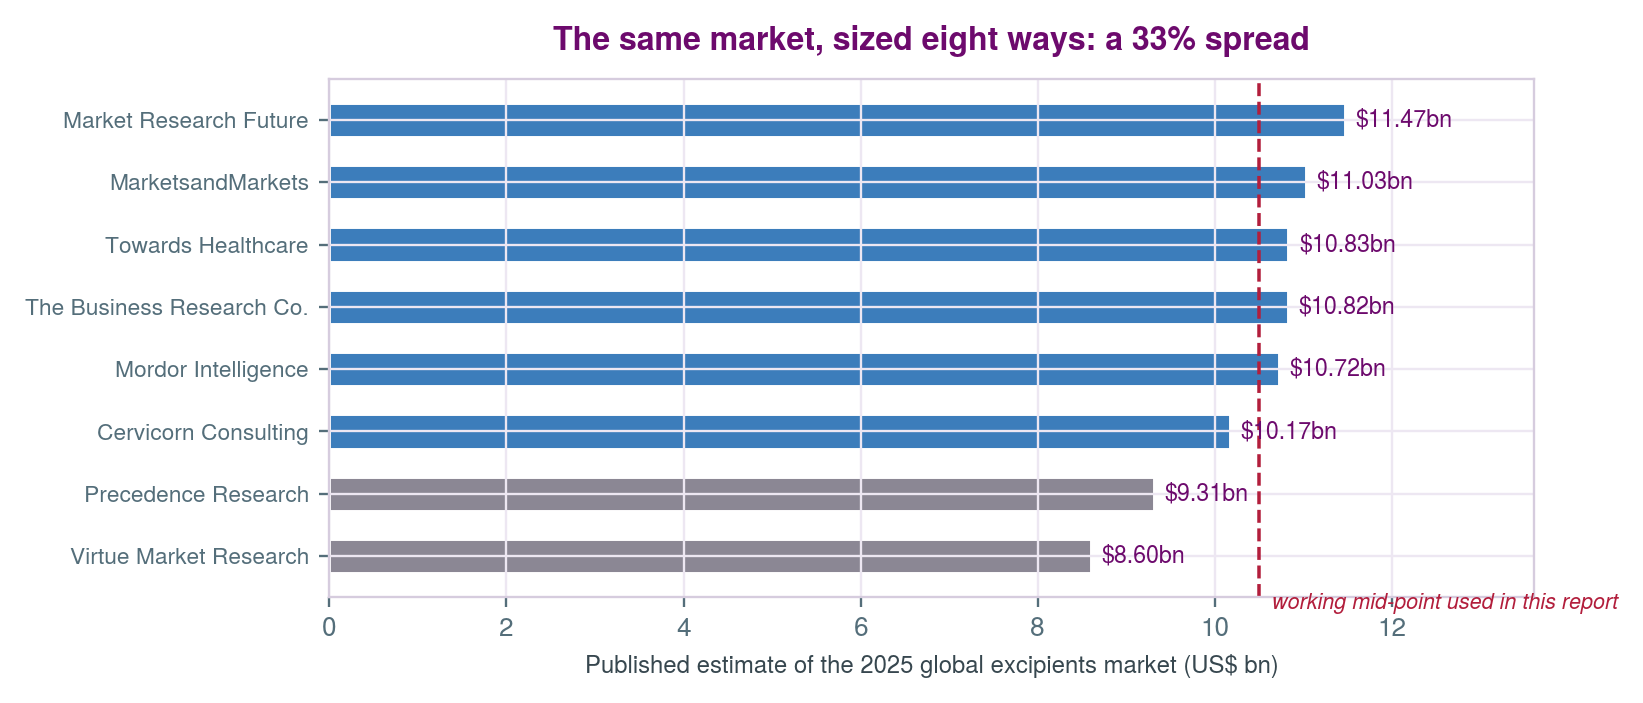
Published estimates of this market disagree violently. For the same year, reputable research houses put the global excipients market anywhere from US$8.6 billion to US$11.5 billion — a spread of roughly a third — with forecast CAGRs ranging from 4% to 8%. The disagreement is not sloppiness; it reflects genuine definitional choices about whether to include food-grade material, packaging components, solvents and captive production.
Treat these numbers as establishing an order of magnitude and a direction, nothing more. The figures that actually matter for an investment case — a company's tonnage, its grade mix, its customer concentration and its realisation per tonne — are all disclosed by the companies themselves and do not require a market-sizing study at all.
What makes this demand unusually resilient is its breadth. It is not a single-driver story but the sum of five concurrent cycles, so no one end-market slowdown derails the thesis.
| Driver | What it pulls | Why it is durable |
|---|---|---|
| Generic volume growth | Standard and specialty MCC, disintegrants, in bulk tonnes | Oral solid dosage remains the dominant delivery form; ageing populations and chronic disease drive unit volume irrespective of drug pricing |
| Direct compression & continuous manufacturing | Spray-dried grades, co-processed systems, low-moisture material | A one-way mix shift — once a plant is built without a granulator, it buys premium excipient for that product's life |
| Nutraceuticals, food & clean label | Food-grade MCC, cellulose gel, CMC | Lower specification but large, growing and counter-cyclical to pharma; provides volume ballast for a plant |
| Supply-chain de-risking | Qualification of second and third sources outside China | Western formulators are structurally dual-sourcing; India is the principal beneficiary in cellulosics |
| Regulatory tightening | DMF-backed, audited, documented material only | Nitrosamine and impurity scrutiny permanently disadvantages undocumented suppliers — share transfer without new demand |
Table 6.1 — Five simultaneous demand cycles. Note that the second and fifth are mix drivers rather than volume drivers: they raise the average selling price of the same tonnes, which is why sector revenue can outgrow sector volume for an extended period.
The fifth driver deserves separate attention because it is the closest thing this sector has to a structural, non-cyclical tailwind. Every tightening of impurity expectations — nitrosamines, elemental impurities, residual solvents — raises the documentation burden on the excipient supplier. Suppliers who hold a US Drug Master File, carry third-party GMP certification and can answer a standardised impurity questionnaire in a week keep the business. Suppliers who cannot, quietly lose it.
This transfers revenue from undocumented to documented producers without any new market being created. It is slow, it compounds, and it runs independently of the drug-development cycle. For a producer with a US-DMF and a clean audit history, it is the most reliable growth driver on this page — and it is invisible in every market-size chart.